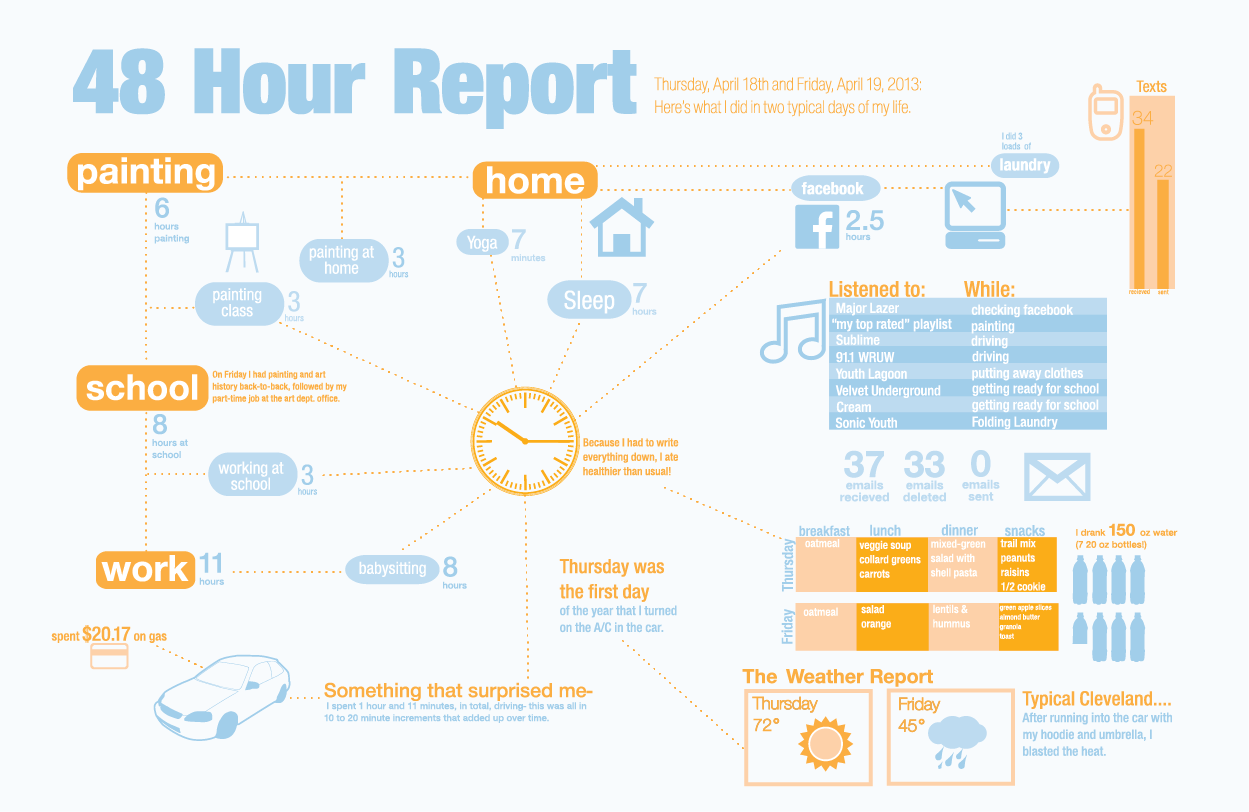
They say time management is the key to success. Scheduling is a given; but what about taking into account how we already spend our time? Some say this is the first step to better time management, so I put this theory to the test. For 48 hours, I wrote down every single thing I did, and how much time it took. I was as honest as possible, and the results were a bit surprising.
This project involved collecting data, almost constantly, for an entire weekend. Then I had to compress and construct the information, making sub-lists and prioritizing what would be most useful, before I created the infographic using Adobe Illustrator. I ultimately printed this out as an 11×17 poster.